
Brandeis University COVID-19 Statistics: Week of Oct. 11
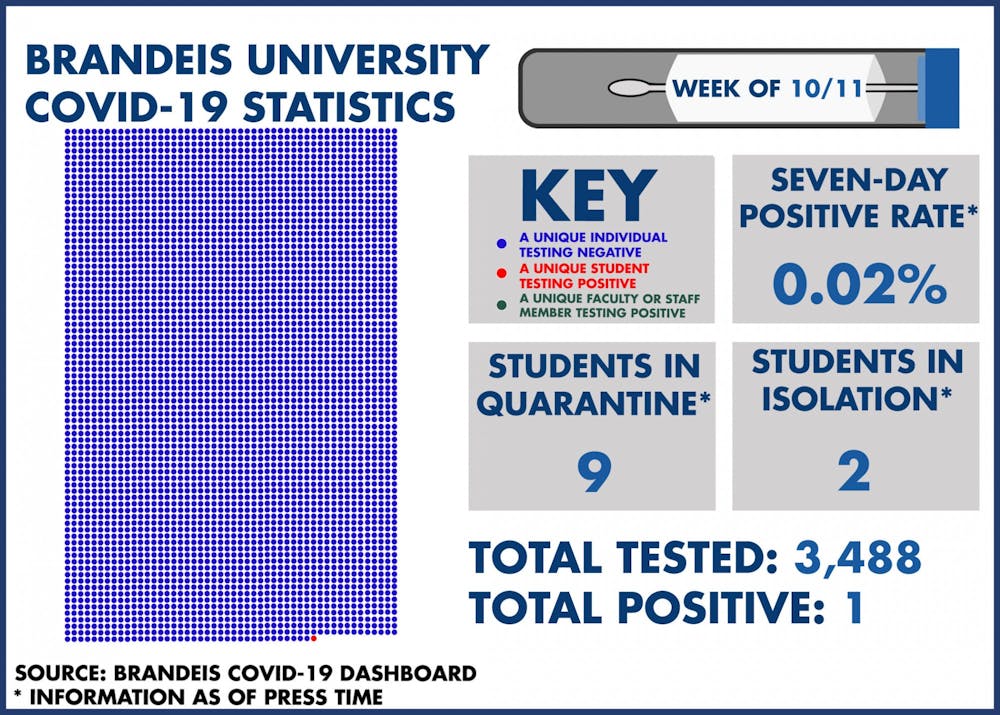
Brandeis University is keeping the community informed about its COVID-19 statistics through an online dashboard. This dashboard contains information about how many tests were collected, how many individuals were tested, how many individuals tested positive, how many students are in quarantine, how many students are in isolation and the seven-day average for positive tests on campus. The dashboard also includes various statistics about areas in Massachusetts. The Justice will produce infographics each week, visually displaying the information that the University releases online.
Top News
Senator Booker breaks record, speaks for 25 hours straight to protest Trump administration’s agenda
by Isaac Birkental | 04/08/2025
2025 Commencement speakers announced
by Hannah Shapiro | 04/08/2025
Senate charters two clubs and debates resolution on transgender athletes
by Justin Rubenstein | 04/08/2025
Period Activists at ‘Deis expand product accessibility
04/08/2025
See The Print

Please note All comments are eligible for publication in The Justice.