
Brandeis University COVID-19 Statistics: Week of Oct. 18
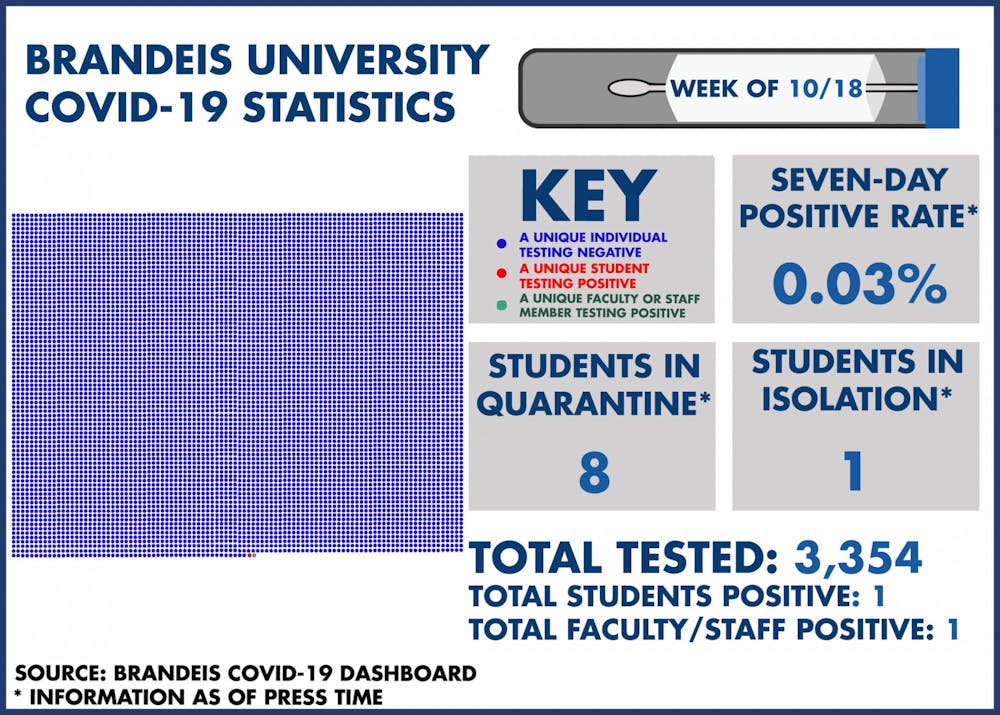
Brandeis University is keeping the community informed about its COVID-19 statistics through an online dashboard. This dashboard contains information about how many tests were collected, how many individuals were tested, how many individuals tested positive, how many students are in quarantine, how many students are in isolation and the seven-day average for positive tests on campus. The dashboard also includes various statistics about areas in Massachusetts. The Justice will produce infographics each week, visually displaying the information that the University releases online.
Top News
The Girl with a Guitar
by Sophia Garcia | 07/03/2026
Examining the March 24 ICE misidentification on campus
by Jateja Spriggs | 05/21/2026
Fighting Authoritarianism Brandeis holds May Day protest
by Chava Thiell | 05/21/2026
New damages found at Polaris lounge
by Ashhwika Soni | 05/21/2026
See The Print

@thejustice
Tweets by thejustice/thejusticenewspaper
Most Popular
See The Print
@thejustice
Tweets by thejusticeRelated Stories
Examining the March 24 ICE misidentification on campus
by Jateja Spriggs | 05/21/2026
Fighting Authoritarianism Brandeis holds May Day protest
by Chava Thiell | 05/21/2026
New damages found at Polaris lounge
by Ashhwika Soni | 05/21/2026
Please note All comments are eligible for publication in The Justice.